
Case study
Your own mobile app doubles revenue in year one (study of 1,337 restaurants)
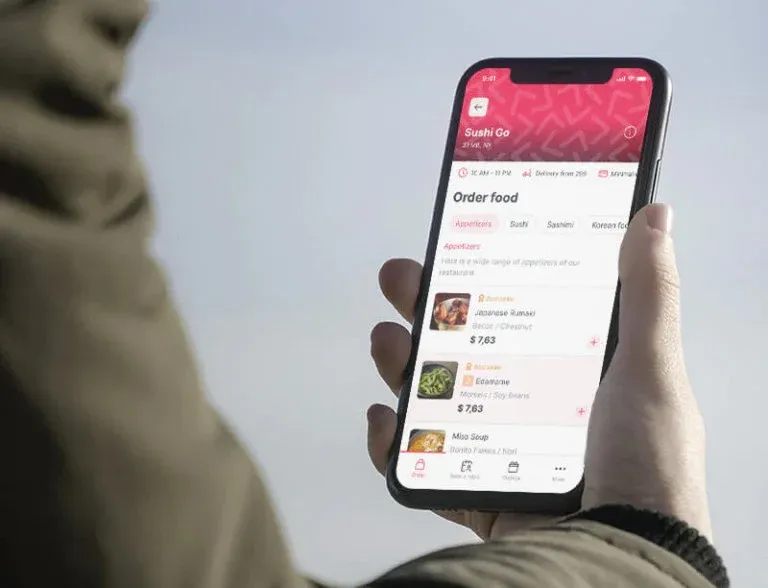
Your own restaurant app is — alongside your ordering website and loyalty program — one of the pillars of building a sales channel you actually own.
But does it really change how people order? Do folks with the app order more often — or do the people who already ordered a lot just happen to be the ones who install it?
We checked it on hard data. Instead of comparing “customers with the app” to “customers without it” (which proves nothing, because it’s your most loyal regulars who install it), we compared the same customer before installing the app and after. So every person is their own benchmark — which kills the “your best customers were always going to install it anyway” objection.
We looked at 72,468 customers across 1,337 restaurants in 69 countries, based on 1.2 million orders over 13+ years.
The result is clear — the app doesn’t just keep a customer. It gets them ordering noticeably more often. And the effect doesn’t fade over time — it grows.
Results
Customers with the app order almost 2x as often (65% more after six months, 87% more after a year).
Over a year, sales from app customers double (+88% after six months, +129% after a year).
The app pushes the order size up too — app customers order not just more often, but bigger.
Among restaurants with at least 100 customers in the analysis, 99% saw orders go up. In one in six, orders at least doubled.
The longer someone has the app, the more they order: +41% after a quarter, +65% after six months, +87% after a year.
Key takeaways
What this means for your restaurant? Make sure you give your customers a mobile app to order from — not just a website. Here’s why:
The app doesn’t bring in new customers — it gets the ones you already have coming back a lot more often. It’s the cheapest loyalty you can buy.
How the app works
We build the mobile app in UpMenu individually for each spot, under its own brand. The app is available to customers on Google Play (Android) and the App Store (iOS). Customers download it and order online even faster and easier. More about the mobile app.
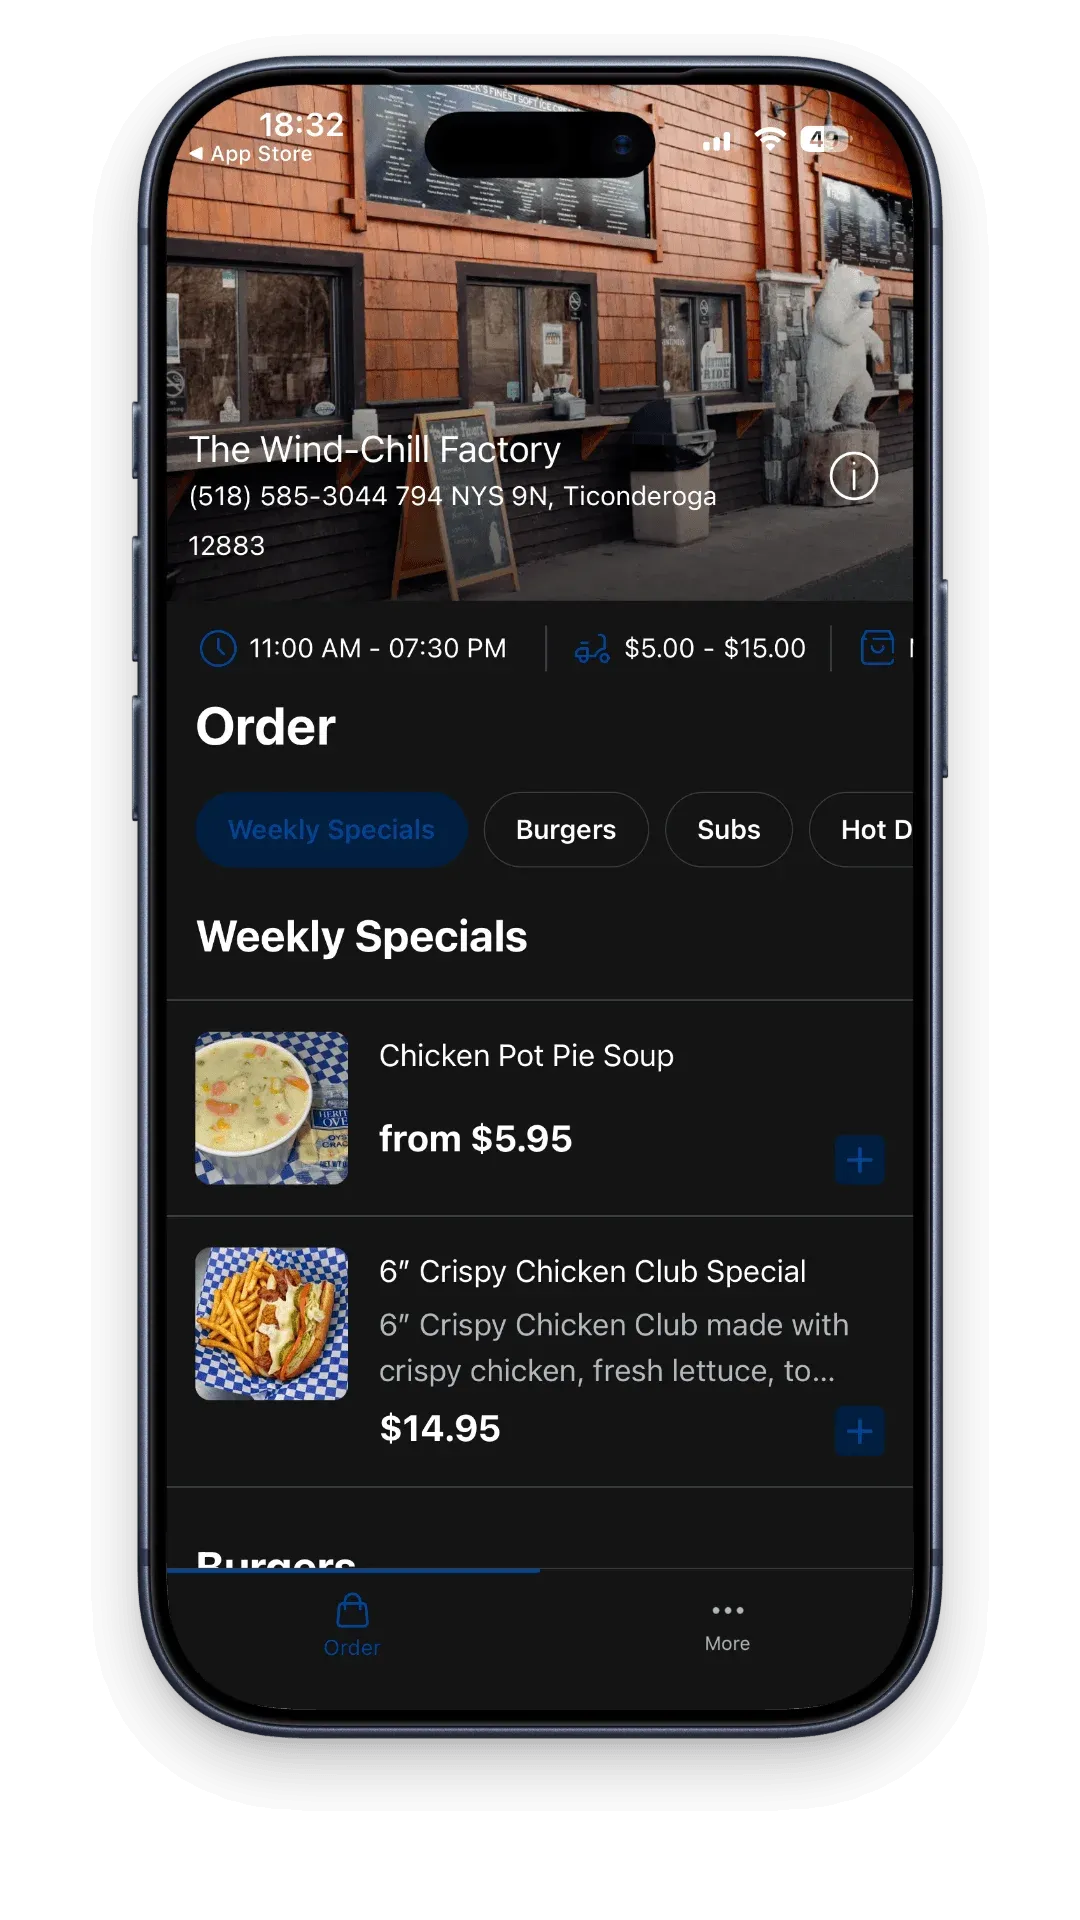
The app boosting sales isn’t magic — it’s about taking the friction out of every step on the way to an order:
- Convenience. You order in a few taps, your delivery address is saved, you pay fast with your phone — that takes out the most tedious part of ordering. A customer who doesn’t have to type in their details every time orders more often, no second-guessing.
- Your restaurant, always within reach. The icon on their phone screen is a constant, quiet reminder. The customer doesn’t have to remember your website or search Google — one glance at their phone does it.
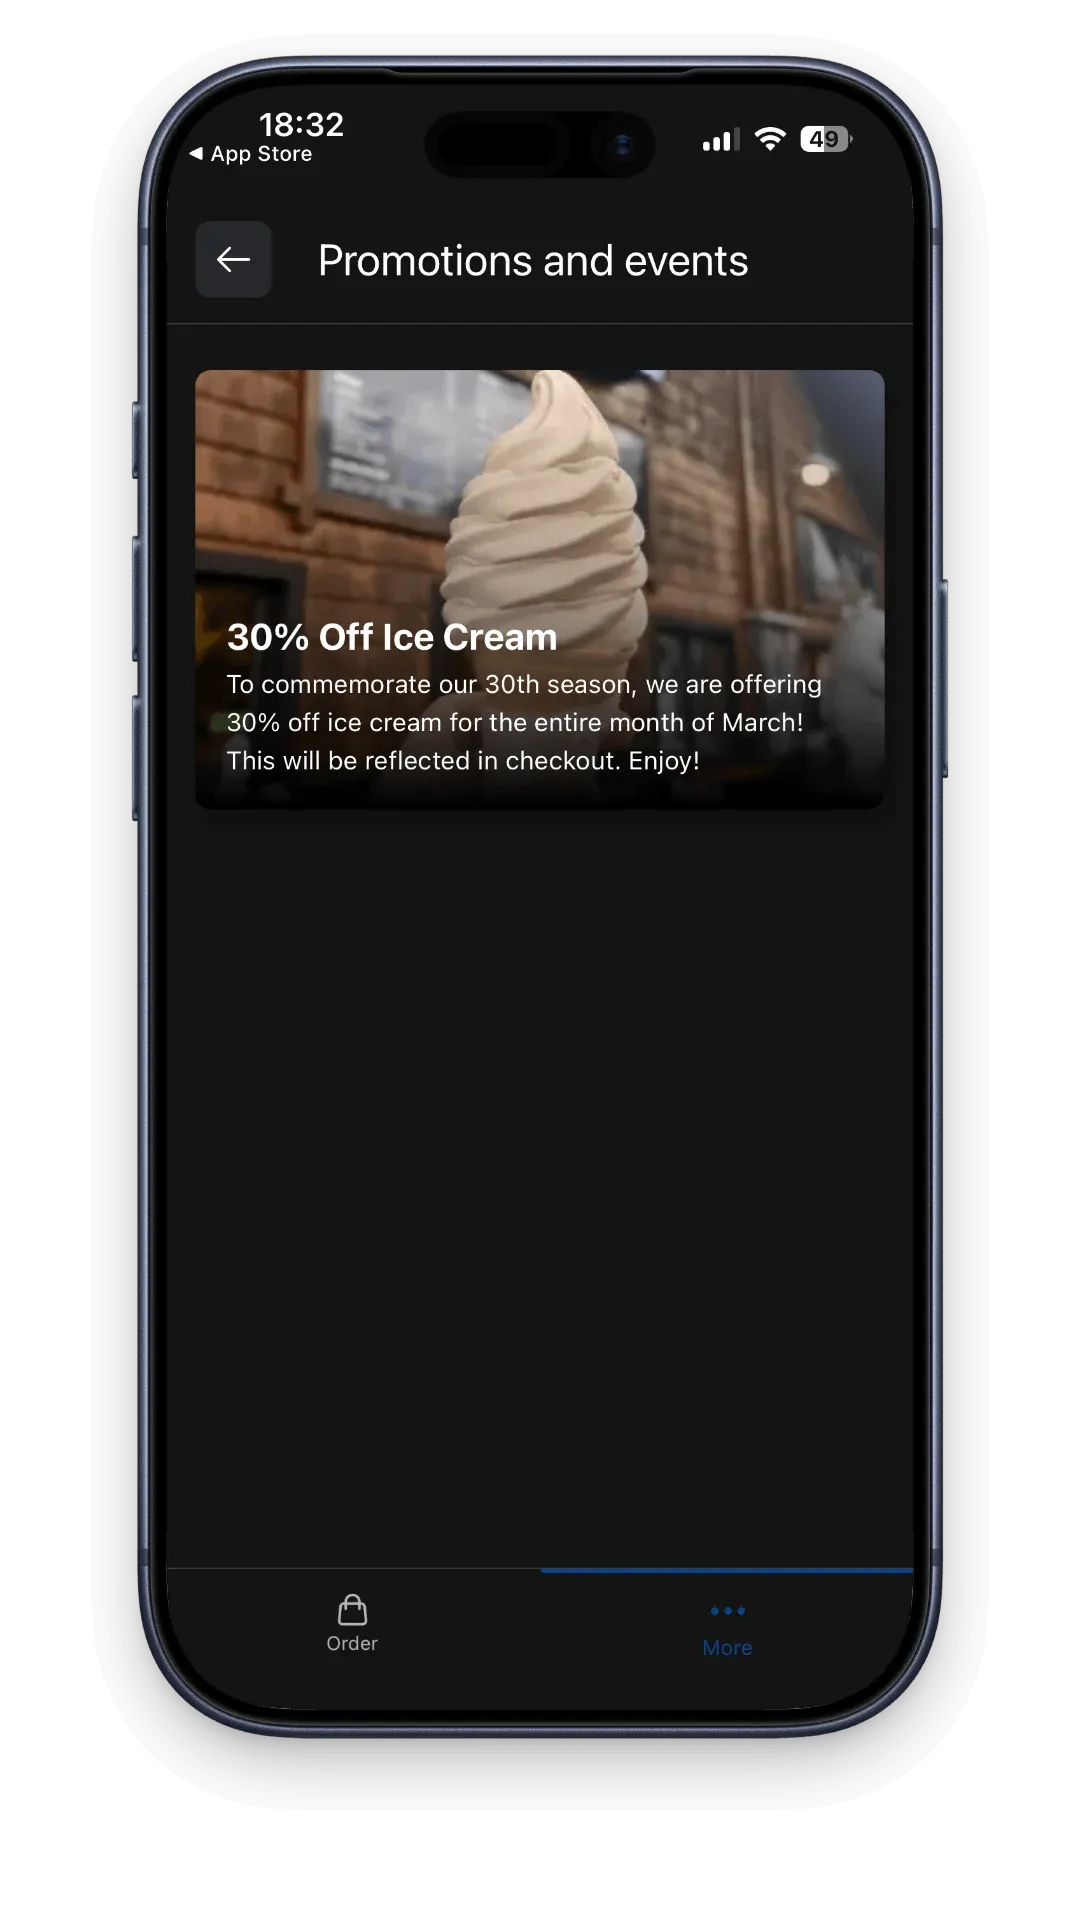
- Push notifications keep you in touch. The app gives you a channel a website doesn’t — push messages with reminders, new items and offers land right on their screen.
- A sense of “their place.” A customer with a specific restaurant’s app has a closer relationship with it than with an anonymous list on an aggregator. They come back to “their” spot instead of scrolling through ten others.
It all adds up to an effect you can see in the data: not a short-lived buzz, but a lasting change in ordering habit.
A customer doesn’t pick the best restaurant — they pick the one that’s closest. The app makes sure you’re the one that’s one tap away, before they even think about the competition.
Sample restaurants and their results
We analyzed every restaurant that gave customers its own app. Among those with at least 100 customers in the analysis, 99% saw orders go up after launching the app. In one in six, orders at least doubled. The effect is consistent regardless of cuisine (pizza, sushi, Thai, fish & chips, healthy meals) and country (Poland, US, Canada, UK, Ireland and dozens more).
The examples below compare six months after the app launch to the six months before, for the same customers.
Restaurant | Country | Customers in analysis | More orders | More revenue |
|---|---|---|---|---|
Pizza na wypasie | PL | 5,872 | +73% | +71% |
Sushi Kushi | PL | 4,379 | +45% | +48% |
Pizzeria K2 | PL | 3,567 | +50% | +59% |
Ideolo | PL | 2,504 | +86% | +95% |
KURA Buffalo Wings | PL | 2,250 | +89% | +81% |
Michelangelo 301 | US | 1,420 | +97% | +86% |
Numazu | PL | 1,059 | +74% | +75% |
The Little Chip Inn | IE | 690 | +119% | +116% |
Smaki Pizzy | PL | 529 | +113% | +101% |
Lil Ava’s Pizza | CA | 583 | +79% | +84% |
Junction Fish Bar | GB | 224 | +130% | +118% |
Dedicate Healthy Kitchen | CA | 275 | +155% | +165% |
Every install is one customer you’ve taken back from the apps. You build your channel, your list, your sales — without paying a cut on guests who were yours to begin with.
How we ran the study (read if you like the details)
The method
The biggest trap in measuring “does the app work” is selection bias: it’s usually your most loyal regulars who install the app, so just comparing “with app vs without” proves nothing — it would only show that loyal people are loyal. We solved it differently: for each customer, we compared their own orders before installing the app and after. The same person is their own benchmark, so their “type” (die-hard regular or occasional customer) doesn’t matter — all that counts is the change in their behavior.
To keep the comparison fair, we used symmetrical windows: the same amount of time before the install as after (3, 6 and 12 months). We measured order frequency, not the raw total — that way a customer who’s had the app for two years is comparable to one who’s had it for six months. We also excluded cancelled and unpaid orders, so we count only sales that actually went through.
Who made it into the study (and why exactly 72,468 people)
More than 523,000 customers have the app, but for the “before vs after” analysis we deliberately allowed only those we could compare fairly — that is, with order history both before installing the app and after. In practice that meant three conditions at once: installation from 2019 onward, a full observation window after install (e.g. for the six-month result — at least 6 months since install), and at least one order before installing, so there was something to compare against in the first place. That last condition is the most important, and it deliberately works against us: it excludes customers who only started ordering after installing the app — and therefore those with potentially the biggest growth (from zero to regular orders). In other words, the real effect across the whole base is most likely higher than what we show; we chose the more conservative, harder-to-challenge sample.
Study results
The difference is big: +65% orders and +88% revenue over the six-month window, and over the full year a full +87% orders and +129% revenue. In absolute numbers: the same customers placed an average of 4.1 orders after installing the app versus 2.5 before, and their revenue rose from PLN 685 to PLN 1,288 per customer (six-month window). These aren’t new customers — they’re exactly the same people who, after installing the app, started ordering more often and spending more.
Time window | Customers in analysis | More orders | More revenue |
|---|---|---|---|
3 months | 66,005 | +41% | +74% |
6 months | 72,468 | +65% | +88% |
12 months | 78,582 | +87% | +129% |
Verifying the results
To be sure, we double-checked the result three more ways:
- The durability curve — is it just a “novelty effect”? We calculated the effect separately for the 3-, 6- and 12-month windows. If the app only gave a short burst of enthusiasm right after install, the effect would shrink over time. The opposite happened: +41% after a quarter, +65% after six months, +87% after a year. The effect doesn’t fade — it deepens. You can see the same in absolute numbers: the average number of orders per customer rises from 2.5 before install to 4.1 after six months and nearly 6 over a year.
- A control group — is it just a general market trend? We took 645,603 customers without the app and checked how their order frequency changed over time (comparing the first half of their history to the second). But customers without the app don’t grow — their activity in the second half of their history is clearly lower than in the first. That means the +65–87% lift for app customers is a real effect of the app, not market background. And measured against what would have happened without the app, the effect is even bigger.
- Year-over-year base stability — isn’t the market just “growing”? We also checked how many orders per customer the whole base places year over year. It turned out flat: 2.50 in 2024 and 2.52 in 2025 — virtually unchanged. Since the average customer doesn’t order more often from one year to the next on their own, the 65–87% jump after installing the app can’t be a result of general market growth. It must come from the app.
Consistency at the level of every restaurant. We analyzed each restaurant on its own. Among spots with a reliable sample (at least 100 customers in the analysis), 99% saw orders go up — of 134 such restaurants, only one didn’t grow. The median uplift (+64%) matched the result for the whole customer base (+65%), which confirms the effect isn’t an average hiding failures, but a rule that holds restaurant by restaurant.
One important caveat
Comparing “before vs after” on the same customer is a strong method, but it’s not a perfect lab experiment — we didn’t randomize who got the app. That’s why the most convincing thing is the consistent picture from four independent checks: same-customer comparisons, the rising durability curve, the no-app control group, and the stable year-over-year base trend. All four point the same way. It’s also worth remembering that part of the first-quarter effect is the natural enthusiasm right after install — but since the effect is even bigger over the full year, it’s not just a “honeymoon.”
Date of the study
June 2026 (analysis of system data as of June 28, 2026).
Period studied
Data spanning 13+ years — from January 2013 to June 2026.
Scope of data analyzed
72,468 customers from 1,337 restaurants using UpMenu, across 69 countries, based on 1,205,843 orders. In total, more than 523,000 customers use UpMenu apps; the “before vs after” analysis included those with order history both before and after installing.