30+ Restaurant Metrics: How to Calculate & Improve Them

What distinguishes good restaurant owners from great ones is their familiarity with the key restaurant metrics. These metrics give insights into different parts of your business and help you make better decisions, improve operations, and, ultimately, maximize profits.
In this article, we’ll review over 30 essential restaurant metrics that we believe a restaurant owner should know. If concepts like total variable costs, prime costs, gross profit margin, or fixed overhead costs don’t ring too many bells, you’ll really want to read this.
Overview of Different Types of Metrics

Restaurant performance metrics include sales, cost, profitability, operational efficiency, customer, employee, and waste management. Each metric gives specific insights into your restaurant’s health and performance.
Understanding these metrics allows you to see the bigger picture, find trends, and make changes that help your restaurant grow and run smoothly. In this article, we’re going to go over 30 different key restaurant metrics separated into nine different categories:
- Sales metrics
- Cost metrics
- Profitability metrics
- Operational efficiency metrics
- Customer metrics
- Employee metrics
- Waste management metrics
- Advanced analytics metrics
- Performance improvement metrics
Importance of Metrics: the Olive Garden Example
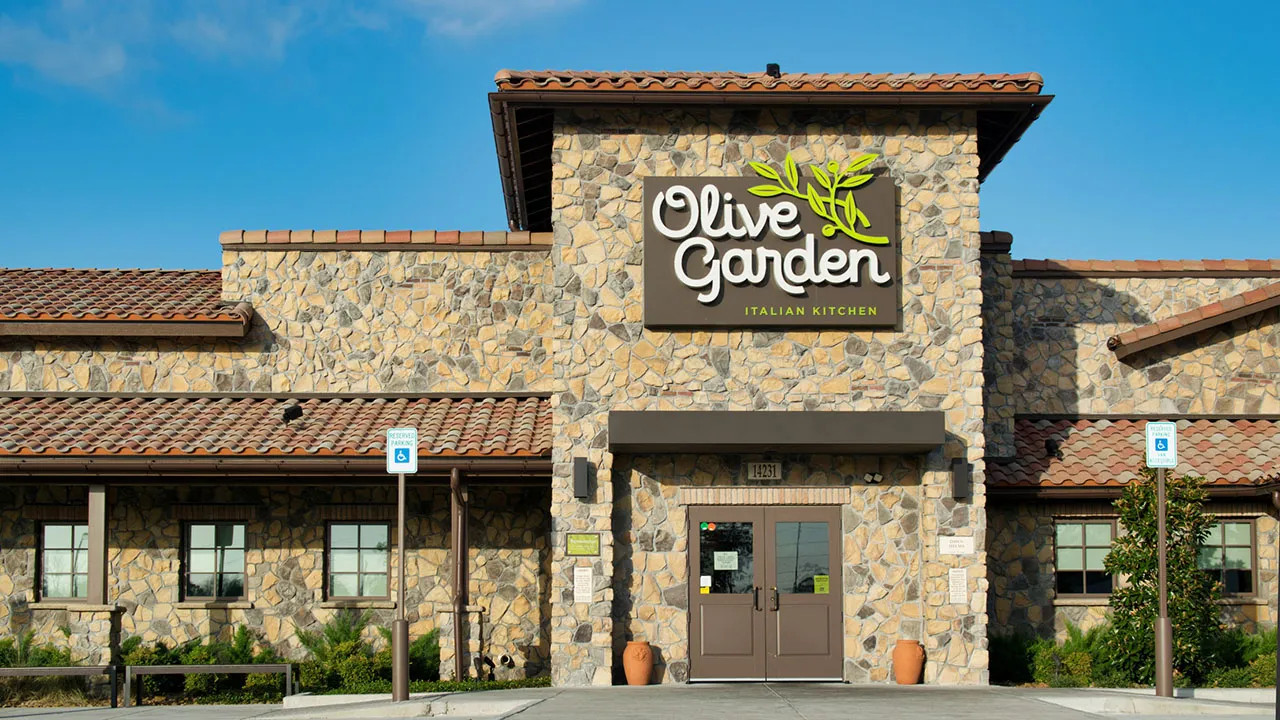
Olive Garden is a great example of how effective metrics can transform a restaurant. It all started in 2014 when Starboard Value took control of Olive Garden and implemented a data-driven turnaround strategy.
Their strategy was not your usual corporate mumbo-jumbo. In fact, the new CEO, Jeffrey Smith, rolled up his sleeves and took the entire board of directors to experience a day’s work at one of the chain’s restaurants to understand the day-to-day operations better. This hands-on approach helped them identify key areas for improvement.
The insights gained from this initiative were quite remarkable. For example, Olive Garden’s breadstick sandwiches, a new menu item that executives credited as a significant success factor, originated from an Olive Garden restaurant manager.
By focusing on various performance metrics, Olive Garden made several strategic changes. They optimized labor costs, improved their menu based on customer preferences, and streamlined operations to enhance efficiency.

These efforts paid off in dividends. Olive Garden saw record profit growth and improved restaurant-level margins, achieving a record segment profit of $281.6 million in a single quarter and maintaining high customer satisfaction rates.
The restaurant also reached a restaurant-level margin of 25.5%, also a company record. The chain’s sales and customer engagement also increased due to strategic changes like better inventory management and targeted marketing efforts.
Before We Start
Keep in mind that the effectiveness of tracking restaurant metrics will largely depend on the restaurant analytics software you use. The effectiveness of your data management translates directly to your service quality, food and beverage costs, and, finally, overall restaurant revenue. Make sure to do due diligence when researching your analytics software, as it might make or break you.
30+ Key Restaurant Metrics

When it comes to restaurant metrics, less is not always better. It might be argued that the key metrics should be limited to complete basics, such as net profit margin, basic sales, food, and labor costs.
However, understanding a couple of more advanced metrics can only boost your restaurant operations. Examples of this would be operational efficiency metrics, such as table turnover ratio and vendor performance. Below we’ll go through over thirty restaurant metrics we consider absolutely essential to good overall restaurant performance.
1. Restaurant Sales Metrics
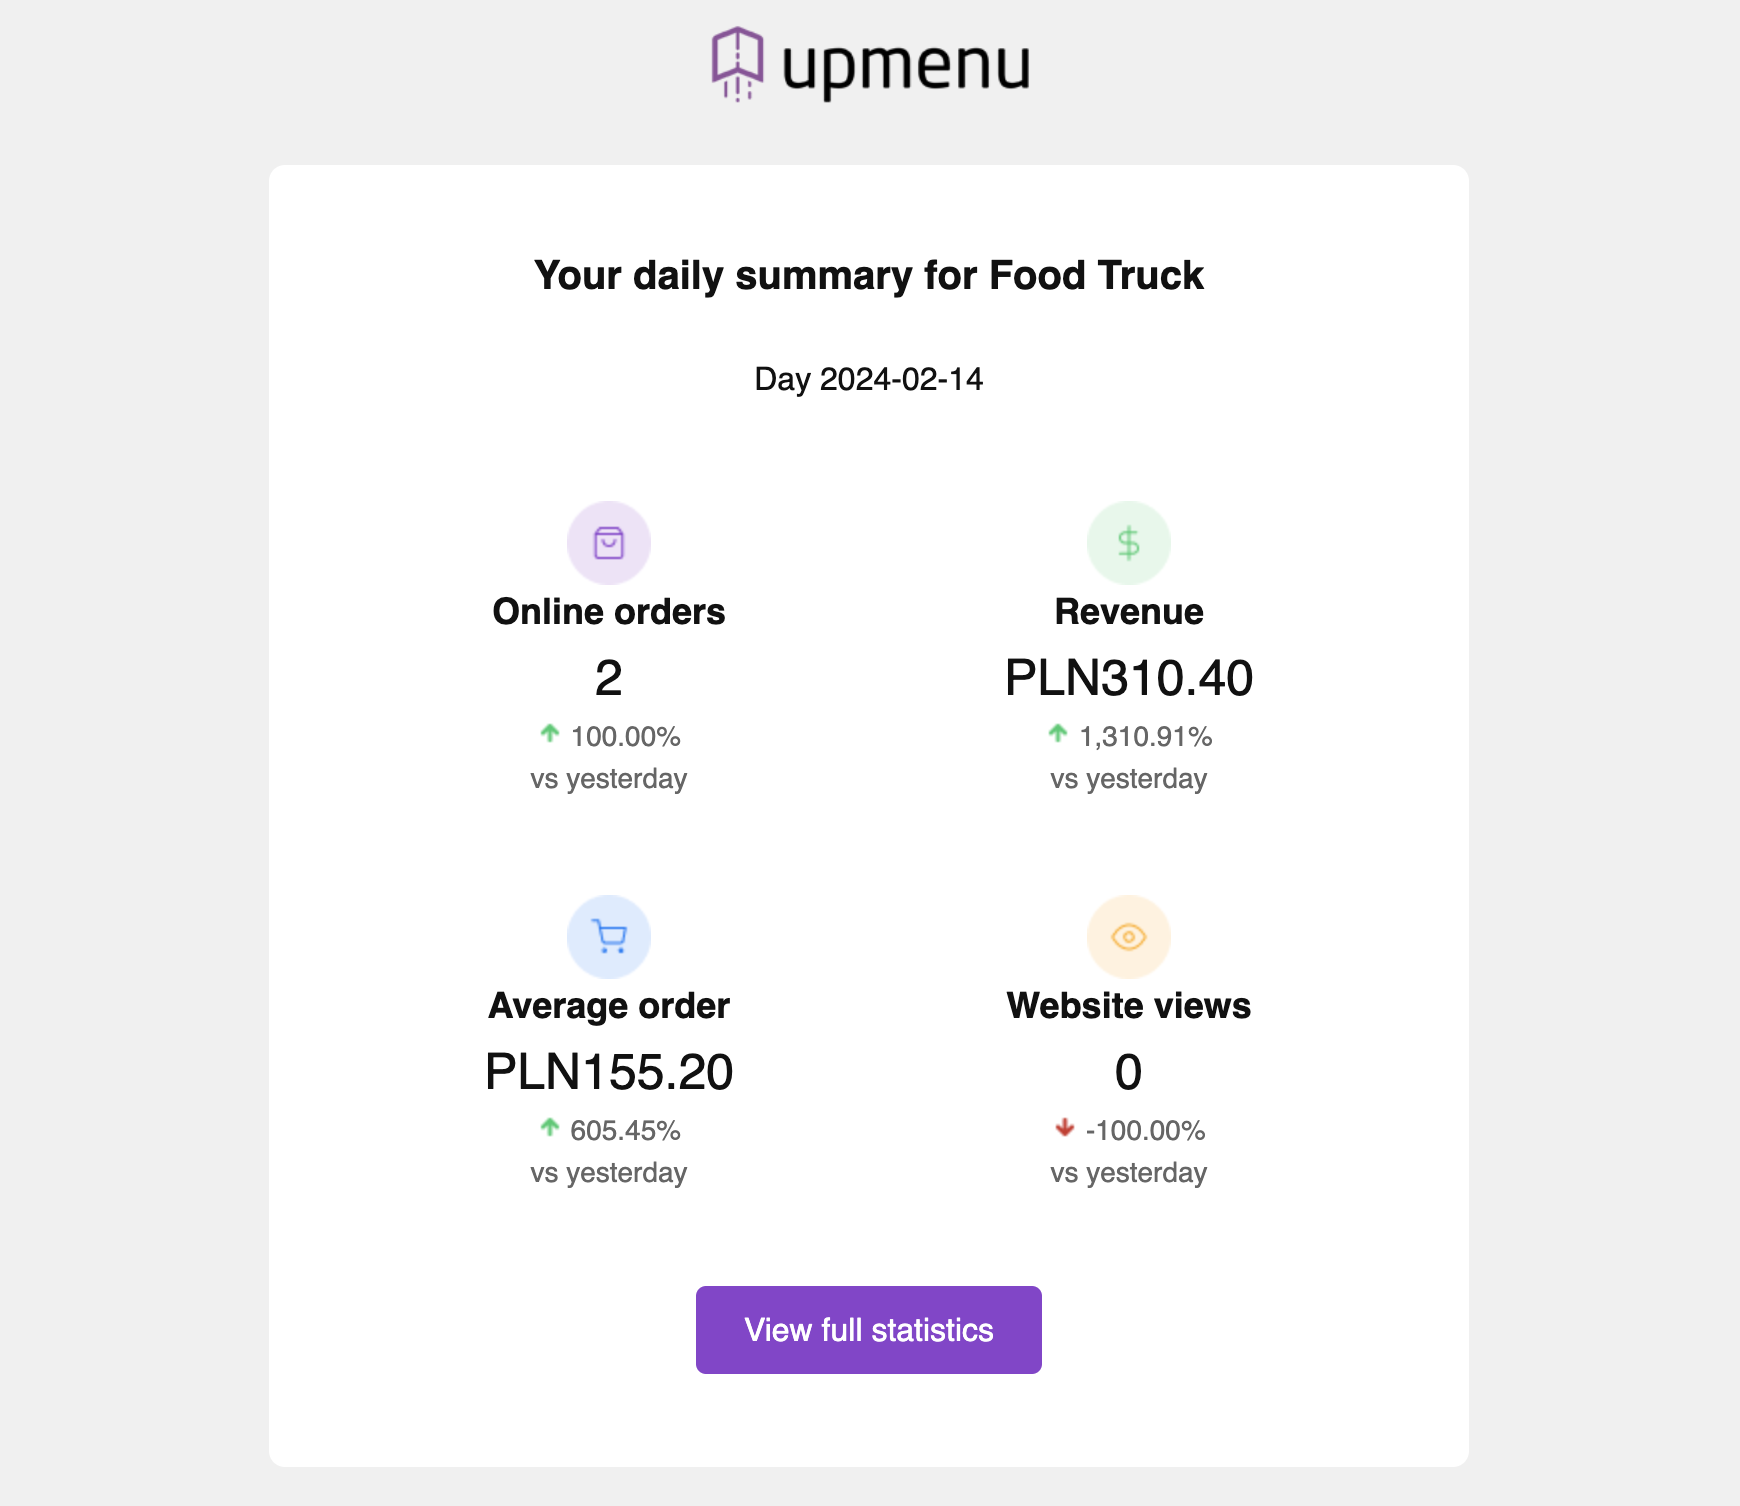
Sales metrics are the key to understanding how well your restaurant is performing in terms of revenue generation. They help you gauge the effectiveness of your sales strategies, pricing, and overall customer appeal. They’re also quite motivating to track. P.S. You can track all of the key metrics from your UpMenu restaurant order-taking app and right from your restaurant’s UpMenu dashboard.
1.1. Restaurant Total Sales
Now, let’s get to business. Total Sales measures the total revenue generated from all sales within a specific period. This fundamental metric provides an overview of your restaurant’s financial health and helps set benchmarks and measure growth over time. To calculate total sales, simply sum all sales transactions within the given period.
1.2. Sales per Square Foot
Sales per Square Foot evaluates the revenue generated per square foot of restaurant space. This metric helps assess the efficiency of space usage and can guide decisions on layout and design improvements. It is calculated by dividing total sales by the total square feet of the restaurant.
1.3. Sales per Labor Hour
Sales per Labor Hour measures the revenue generated per hour of labor. This metric helps in assessing labor productivity and can inform staffing decisions to ensure optimal labor costs. To calculate this, divide total sales by the total labor hours.
1.4. Average Check Size
Average Check Size is the average amount spent by customers per visit. This metric provides insights into customer spending behavior and helps in adjusting menu pricing and promotions. It is calculated by dividing total sales by the number of checks.
1.5. Sales per Seat Hour (RevPASH)
Sales per Seat Hour (RevPASH) measures revenue generated per seat per hour. This metric helps understand how well your seating capacity is being utilized. It is calculated by dividing total sales by the number of seats multiplied by the hours the restaurant is open.
2. Cost Metrics
Cost metrics are crucial for understanding and managing the expenses associated with running a restaurant. They help you monitor and control costs, which is essential for maintaining profitability.
2.1.Cost of Goods Sold (COGS)
Cost of Goods Sold (restaurant COGS) represents the direct costs attributable to the production of the food and beverages sold by the restaurant. It includes the cost of ingredients and raw materials. This metric is important because it directly impacts the restaurant’s gross profit. To calculate COGS, you add the beginning inventory and purchases during the period and subtract the ending inventory.
2.2. Food Cost Percentage
Food Cost Percentage is the ratio of the cost of ingredients used to produce menu items to the revenue generated from those items. This metric helps in assessing how efficiently you are using your ingredients and managing menu prices. To calculate food-cost percentage, you’re going to divide the COGS by total food sales and multiply by 100 to get a percentage.
2.3. Beverage Cost Percentage
Beverage Cost Percentage is similar to the food cost percentage but focuses on the cost of beverages. It helps manage and price the drinks menu effectively. It is calculated by dividing the cost of beverages by total beverage sales and multiplying by 100.
2.4. Prime Cost
Prime Cost is the sum of COGS and total labor costs. This metric is crucial because it represents the largest controllable cost in a restaurant and directly affects profitability. It is calculated by adding COGS and total labor costs.
Tracking these cost metrics regularly allows you to identify inefficiencies, control expenses, and make informed decisions to improve overall profitability.
3. Profitability Metrics

Profitability metrics are essential for understanding how well your restaurant is converting sales into profits. They help you assess your business’s financial health and identify areas for improvement.
3.1. Gross Profit
Gross Profit measures the difference between total sales and the cost of goods sold (COGS). This metric indicates how effectively a restaurant is managing its production costs relative to its sales.
3.2. Net Profit
Net Profit represents the profit remaining after all expenses, including operating expenses, interest, taxes, and other costs, have been deducted from total revenue. This metric is crucial for assessing the restaurant’s overall profitability.
3.3. Contribution Margin
Contribution Margin measures the amount each unit sold contributes to covering fixed costs and generating profit. It is calculated by subtracting the variable costs per unit from the selling price per unit. This metric helps in pricing decisions and understanding the profitability of individual items on the menu.
3.4. Break-Even Point
Break-Even Point is the level of sales at which total revenue equals total costs, resulting in neither profit nor loss. This metric is important for understanding the minimum sales volume needed to cover all expenses.
3.5. Prime Cost
Prime Cost is the sum of COGS and total labor costs. It is a key metric because it represents the largest controllable cost in a restaurant and directly impacts profitability. Prime cost should ideally be less than 60-65% of total sales.
4. Operational Efficiency Metrics

Operational efficiency metrics help you understand how well your restaurant is using its resources to generate revenue. These metrics focus on optimizing processes, improving productivity, and reducing waste, which ultimately leads to higher profitability.
4.1. Inventory Turnover Ratio
Inventory Turnover Ratio measures how often inventory is used and replaced in a given period. A higher ratio indicates efficient inventory management, meaning you’re not overstocking or understocking items. To calculate the inventory turnover ratio, divide COGS by the average inventory.
4.2. Table Turnover Rate
Table Turnover Rate measures the number of times a table is occupied and vacated during a service period. This metric is important for maximizing seating capacity and revenue. It is calculated by dividing the total number of parties served by the number of tables available.
5. Customer Metrics
Customer metrics are vital for understanding customer behavior, satisfaction, and retention. These metrics help you gauge how well your restaurant is meeting customer expectations and identify areas for improvement to enhance the overall dining experience.
5.1. Customer Acquisition Cost (CAC)
Customer Acquisition Cost (CAC) measures the cost associated with acquiring a new customer. This metric is important for assessing the efficiency of your marketing and advertising efforts. To calculate CAC, divide the total marketing and sales expenses by the number of new customers acquired during a specific period.
5.2. Customer Retention Rate
Customer Retention Rate indicates the percentage of customers who return to your restaurant over a specific period. High retention rates suggest customer satisfaction and loyalty, which are crucial for long-term success. To calculate the retention rate, subtract the number of new customers from the total number of customers at the end of the period, divide by the total number of customers at the beginning of the period, and multiply by 100.
5.3. Customer Satisfaction Score (CSAT)
Customer Satisfaction Score (CSAT) measures how satisfied customers are with your restaurant. This is typically gathered through surveys where customers rate their satisfaction on a scale, often from 1 to 5. To calculate CSAT, divide the number of satisfied customers (those who rate 4 or 5) by the total number of survey responses and multiply by 100.
5.4. Net Promoter Score (NPS)
Net Promoter Score (NPS) measures customer loyalty by asking how likely customers are to recommend your restaurant to others on a scale from 0 to 10. Customers are classified as Promoters (9-10), Passives (7-8), or Detractors (0-6). To calculate NPS, subtract the percentage of Detractors from the percentage of Promoters:
5.5. Average Customer Spend
Average Customer Spend tracks the average amount spent by customers per visit. This metric helps you understand spending patterns and can inform pricing and promotional strategies. To calculate average customer spend, divide total sales by the number of customers:
6. Employee Metrics
Employee metrics help you stay on top of performance, satisfaction, and retention of your staff. These metrics help you manage your workforce more effectively, improve employee satisfaction, and reduce turnover rates, which can enhance your restaurant’s overall service quality.
6.1. Employee Turnover Rate
Employee Turnover Rate measures the rate at which employees leave your restaurant and need to be replaced. High turnover can indicate problems with job satisfaction, work environment, or management practices. To calculate the turnover rate, divide the number of employees who left by the average number of employees and multiply by 100.
6.2. Labor Productivity
Labor Productivity measures the output generated per labor hour. This metric helps in understanding the efficiency of your workforce and can guide staffing decisions to optimize labor costs. It is calculated by dividing total sales by total labor hours.
6.3. Labor Cost Percentage
Labor Cost Percentage measures the total labor costs as a proportion of total sales. This metric helps in understanding the efficiency of your staffing and can guide decisions on scheduling and labor management. It is calculated by dividing total labor costs by total sales and multiplying by 100.
6.4. Employee Satisfaction
Employee Satisfaction measures how happy your employees are with their jobs. Employee satisfaction can lead to better performance, lower turnover, and improved restaurant customer service. This metric is usually gathered through employee surveys and can be quantified by calculating the percentage of positive responses.
For example, if 80 out of 100 employees rate their job satisfaction as positive, the employee satisfaction rate would be 80%.
6.5. Training Hours
Training Hours per Employee tracks the amount of time spent on training each employee. This metric helps you understand your investment in employee development and its impact on performance and retention. To calculate this, divide the total training hours by the number of employees.
6.6. Absenteeism Rate
Absenteeism Rate measures the frequency and duration of employee absences. High absenteeism can indicate low job satisfaction or health issues and can impact service quality. To calculate the absenteeism rate, divide the total number of absentee days by the total number of available workdays and multiply by 100.
7. Waste Management Metrics

Waste management metrics are essential for identifying inefficiencies in your restaurant’s operations that lead to unnecessary waste and increased costs. By tracking these metrics, you can implement strategies to reduce waste, improve sustainability, and enhance profitability.
7.1. Waste Percentage
Waste Percentage measures the amount of food wasted as a proportion of the total food purchased. This metric helps you understand the extent of waste and the effectiveness of your waste reduction strategies. To calculate the waste percentage, divide the amount of food wasted by the total food purchased and multiply by 100.
7.2. Food Cost Variance
Food Cost Variance measures the difference between the actual cost of food and the theoretical cost based on recipes and portion sizes. A high variance indicates issues with portion control, theft, or waste. To calculate food cost variance, subtract the theoretical cost from the actual cost.
7.3. Inventory Variance
Inventory Variance measures the discrepancy between recorded inventory levels and actual inventory. This metric helps identify issues like theft, spoilage, or inaccurate record-keeping. To calculate inventory variance, subtract the actual inventory from the recorded inventory.
7.4. Waste Disposal Costs
Waste Disposal Costs track the expenses associated with disposing of waste. This metric helps you understand the financial impact of waste and identify opportunities to reduce disposal costs. To calculate waste disposal costs, sum up all expenses related to waste management, including collection, transportation, and landfill fees.
7.5. Portion Control
Portion Control measures the consistency in serving sizes. Inconsistent portions can lead to increased waste and higher food costs. This metric is often tracked through regular audits and comparisons of actual serving sizes to standard portions.
7.6. Spoilage Rate
Spoilage Rate measures the amount of food that spoils before it can be used or sold. This metric helps identify issues with inventory management and storage practices. To calculate the spoilage rate, divide the amount of spoiled food by the total food inventory and multiply by 100.
Using Metrics to Increase Restaurant Performance

Performance improvement involves using the insights gained from various metrics to implement strategies that enhance the overall efficiency, profitability, and customer satisfaction of your restaurant. By focusing on continuous improvement, restaurants can stay competitive and adapt to changing market conditions.
Set Clear Goals and Objectives

Establish specific targets based on your restaurant’s financial metrics. For example, aim to improve our customer satisfaction score by reducing average wait times during peak hours by 20% and increasing our table turnover rate by 15% over the next quarter. Make sure your goals are backed by data, are specific, convey what actions have to be taken, and include the completion date. Once you have the bare bones, continue to develop your objective.
Skillful goal-setting is more important than most restaurant owners believe it to be. In our experience, it’s best not to waste time on goals unless you know what you’re doing. Without an actionable goal that clearly specifies all the necessary actions, you most likely won’t achieve any effects. Follow this link to learn more about setting clear restaurant goals.
Regularly Monitor and Review Metrics
Continuously track key performance metrics to identify trends and areas needing improvement. Use dashboards and regular reports to keep an eye on critical metrics like sales, costs, and customer feedback. Regular reviews help in making timely adjustments to strategies and operations.
Implement Employee Training Programs
Investing in staff training can significantly impact performance. Train employees on customer service, upselling techniques, and efficient kitchen practices. Regular training sessions ensure that staff are equipped with the necessary skills to enhance productivity and customer satisfaction.
Optimize Menu Offerings
Use sales and customer feedback data to refine your menu. Remove items that are not performing well and introduce new dishes that cater to customer preferences. Menu optimization helps in reducing food costs and improving customer satisfaction.
Enhance Customer Experience

Focus on improving the overall dining experience. This includes better service, ambiance, and food quality. Use customer feedback to make necessary changes. Implement loyalty programs and personalized marketing to retain customers and encourage repeat visits.
Streamline Operations
Analyze operational metrics to identify inefficiencies in processes such as inventory management, kitchen workflows, and table turnover rates. Implement changes to streamline these processes, reduce waste, and enhance productivity. For example, adopting inventory management software can help maintain optimal stock levels and reduce spoilage.
Adopt Technology Solutions
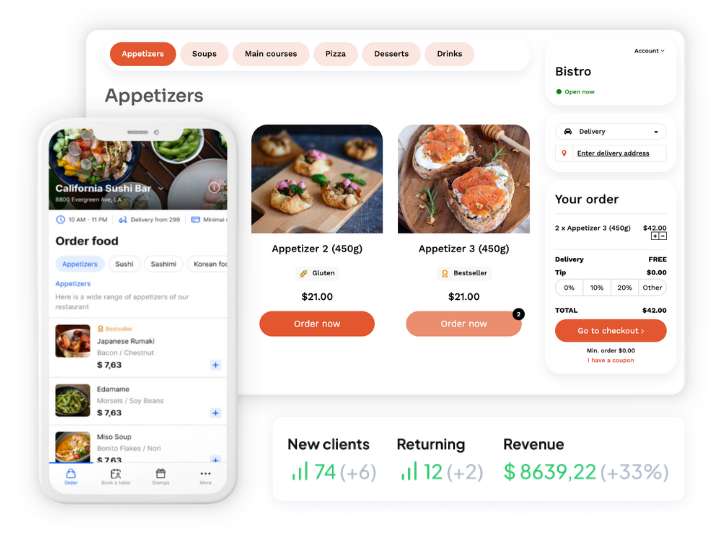
Leverage technology to improve various aspects of restaurant operations. This includes point-of-sale systems, reservation management, and online ordering platforms. Technology can enhance efficiency, reduce errors, and provide valuable data for further analysis.
Conduct Regular Audits
Perform regular audits of different areas of your operations, such as inventory, hygiene, and service quality. Audits help identify issues that might not be apparent through regular metrics tracking and ensure compliance with industry standards and regulations.
Engage and Motivate Staff
A motivated workforce is key to better performance. Foster a positive work environment through recognition programs, incentives, and open communication. Engaged employees are more likely to provide excellent service and contribute to the restaurant’s success.

Adjust Marketing Strategies
Use data from customer segmentation and sentiment analysis to tailor your marketing strategies. Focus on targeted campaigns that address the preferences and behaviors of different customer segments. Effective marketing can drive traffic and increase sales.
Benchmark Against Competitors
Regularly compare your performance metrics with industry benchmarks and competitors. Understanding where you stand in the market can provide insights into areas that require improvement and help in setting realistic performance goals.

Frequently Asked Questions (FAQ)
Key Performance Indicators (KPIs) are specific, measurable metrics that businesses use to track and evaluate their success in achieving key objectives. For restaurants, KPIs help monitor performance, identify areas for improvement, and make informed decisions.
Revenue and Sales Growth: Track total revenue over time.
Profit Margins: Measure profitability through gross and net margins.
Average Revenue per Customer: Calculate the average spend per customer visit.
Customer Satisfaction: Monitor reviews, ratings, and Net Promoter Score (NPS).
Customer Retention Rate: Track the percentage of repeat customers.
Table Turnover Rate: Measure how quickly tables are cleared and reset.
Food and Labor Cost Percentages: Track the ratio of food and labor costs to total sales.
Inventory Turnover: Measure how quickly inventory is used.
Employee Turnover Rate: Monitor the rate at which employees leave.
Social Media Engagement: Track likes, shares, comments, and follower growth.
These restaurant KPIs provide a comprehensive view of a restaurant’s operational and financial health.
The five key metrics used to measure restaurant performance are:
Revenue and Sales Growth: Track total revenue over time to assess overall financial performance and growth trends.
Profit Margins: Measure profitability through gross and net profit margins to determine how well costs are managed relative to revenue.
Customer Satisfaction: Monitor customer feedback through reviews, ratings, and Net Promoter Score (NPS) to gauge how well the restaurant is meeting customer expectations.
Food and Labor Cost Percentages: Track the ratio of food and labor costs to total sales to ensure efficient cost management and identify areas for potential savings.
Table Turnover Rate: Measure how quickly tables are cleared and reset for new customers, indicating the restaurant’s efficiency in serving more guests and maximizing revenue.
About the author

Senior Content Writer
Creative digital writer and marketer. A caffeine-fueled madman who loves to make things better.