

Crafting a robust budget is vital for both new and established businesses. This article provides a deep dive into key budgeting areas, offering practical advice supported by examples and best practices.
The article will function as a restaurant budget template. We’ve organized it so that you can skip to the parts that interest you the most. Whether you’re just beginning to build your restaurant business or are simply looking to re-evaluate your budget, you’re in the right place.
Why You Need a Restaurant Budget

A restaurant budget gives you a ground to stand on. By tracking key expenses, you can make informed decisions, balance financial commitments, and steer your businesses forward.
In other words, without one, you’re just going to be stuck in a flux, wondering where is all of your money going.
Restaurant Budget Breakdown: The Key Factors in Building Your Restaurant’s Budget
There are few fixed costs in the restaurant industry. Utilities, labor, food costs, and marketing costs will largely depend on the restaurant’s financial health, as well as revenue projections, profit margins, sales forecasting, and other factors.
Depending on your restaurant expenses, net income, and how much profit you make, you’re going to have to review your budgeting processes time and again to keep it up to date.
Let’s break down the key parts of a restaurant budget.
1. Revenue Projections as the Base of Proper Restaurant Budgeting

Revenue projections are essential for the proper allocation of funds. These projections are based on detailed market research for new ventures or historical sales data for established budget restaurants. They are adjusted for expected trends, customer preferences, and seasonal changes.
2. Restaurant Business Profit Margins

Profit margins in a restaurant are critical in influencing overall costs. A higher profit margin means the restaurant efficiently manages its costs relative to its revenue.
Higher profit margins allow you more freedom for reinvestment, growth, and cushioning against unexpected expenses. Conversely, low profit margins indicate that costs are a large portion of revenue. In that case, you might want to revise your budget.
Think of your restaurant budgeting process as a constant task that needs to be tended to regularly. Your restaurant business is a living organism.
As more business comes your way, more financial decisions you’ll have to make. Set aside a restaurant marketing budget, dive deeper into food costs, and keep a proactive approach.
3. Restaurant Industry and Food Costs

Food costs in a restaurant are usually calculated as a percentage of the restaurant’s total sales revenue, typically assessed monthly or quarterly.
This allows for more responsive management of these costs in relation to fluctuating sales and varying ingredient prices. The general guideline for restaurants is to aim for food costs to be about 28-35% of their total sales during these shorter periods, ensuring a balance between quality and profitability.
Key points to keep in mind:
- Aim for food costs to be 28-35% of total sales to balance quality and profitability.
- Regularly review supplier prices to find the best deals and manage costs.
- Adjust menu prices based on the cost of ingredients and desired profit margins.
- Monitor sales data to understand which dishes are profitable and which are not.
- Regularly analyze food cost percentages and adjust operations as needed.
To maintain a food cost percentage of 25%, the dish should be priced at $20. This pricing strategy ensures that the food costs are adequately covered while contributing to the restaurant’s profitability.
4. Contingency Fund – a Must for All Restaurant Owners
 A contingency fund is vital to manage unexpected expenses and ensure continuity. It provides financial security for unforeseen costs, such as emergency equipment repair, which can be significant in the restaurant industry.
A successful restaurant often relies on this fund to quickly address issues, especially with critical restaurant equipment, without impacting its service or financial stability. This fund acts as a buffer, helping restaurants spend on urgent needs without jeopardizing their day-to-day operations.
5. Get Ahead With Restaurant Marketing and Advertising

Marketing and advertising costs can vary widely and often include expenses for online advertising, print ads, promotional events, and social media campaigns.
Setting aside a marketing budget that aligns with your restaurant marketing plan is a good way to boost your business.
The amount of money you allocate to marketing costs is a personal matter that you best settle by preparing a complete restaurant marketing budget.
6. Don’t Let Rent and Utilities Bother You
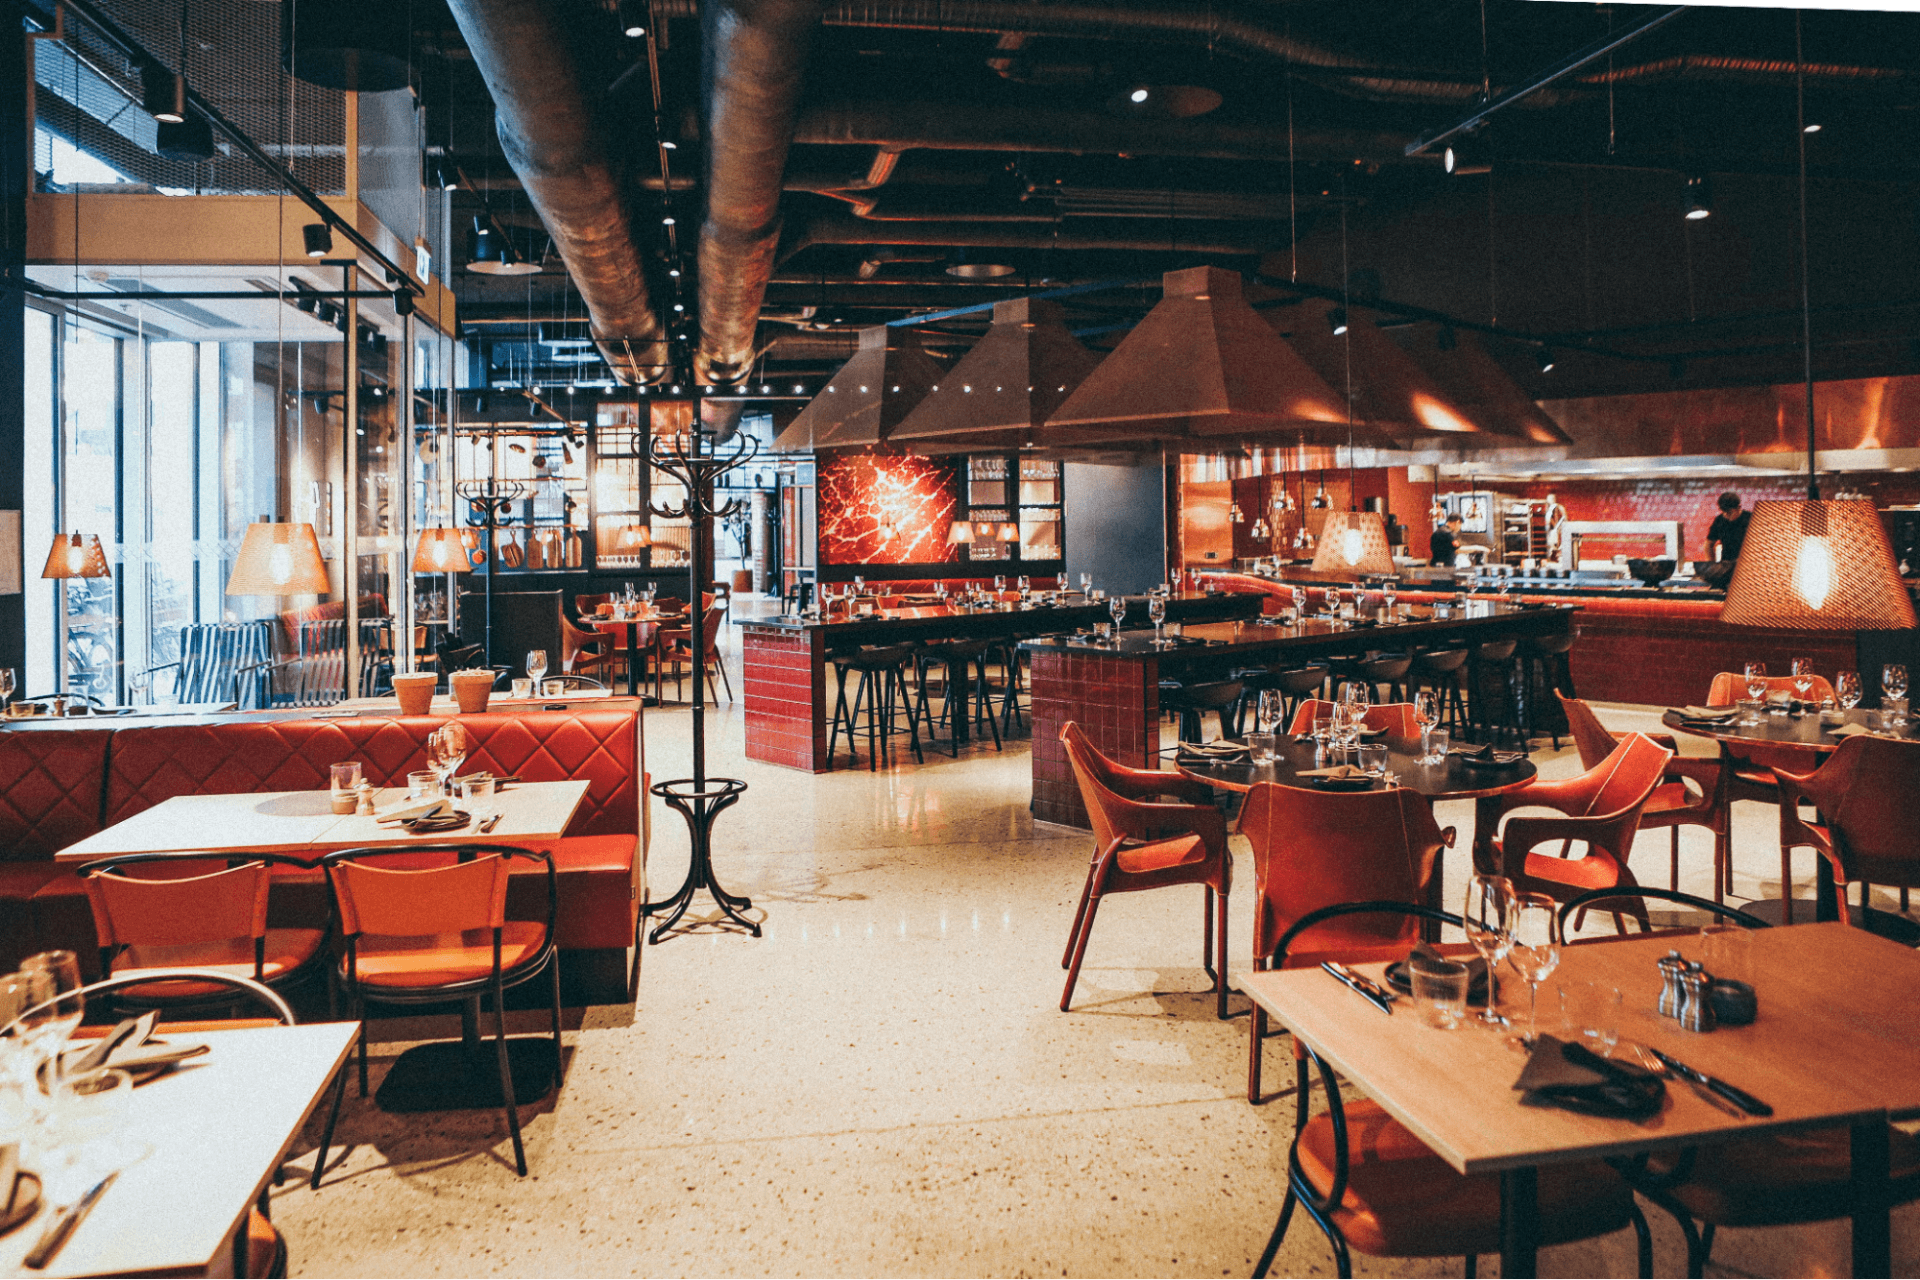
Typically, rent should not exceed 5-10% of your monthly revenue. The exact percentage of these semi-variable costs can vary based on location and restaurant size.
Meanwhile, gas, electricity, and water utilities can take up around 3-5% of your revenue. Consider energy-efficient appliances, LED lighting, and water-saving devices to save on utilities. Regular maintenance of equipment also helps in reducing energy consumption.
If you’re short on funds, you might want to consider a restaurant loan. If it’s the price of renting a physical location that is your biggest conundrum, why not start with a ghost kitchen?
7. Invest in a Solid Restaurant Ordering System
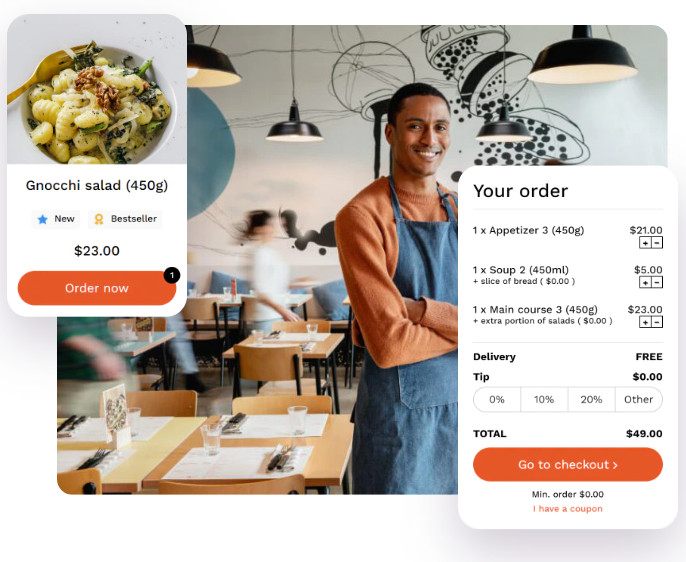
A food ordering system is a key element for streamlining operations, enhancing customer experience, and boosting sales. Investing in a good ordering system is vital, but it must align with overall restaurant costs.
8. Perform a Regular Labor Costs Review

Labor costs in a restaurant should ideally range between 25-35% of total revenue. To minimize these costs, optimize staff scheduling to match customer traffic, invest in training to increase employee efficiency, and consider using technology to automate simple tasks like tableside ordering.
9. Optimize the Costs of Your Operating Supplies
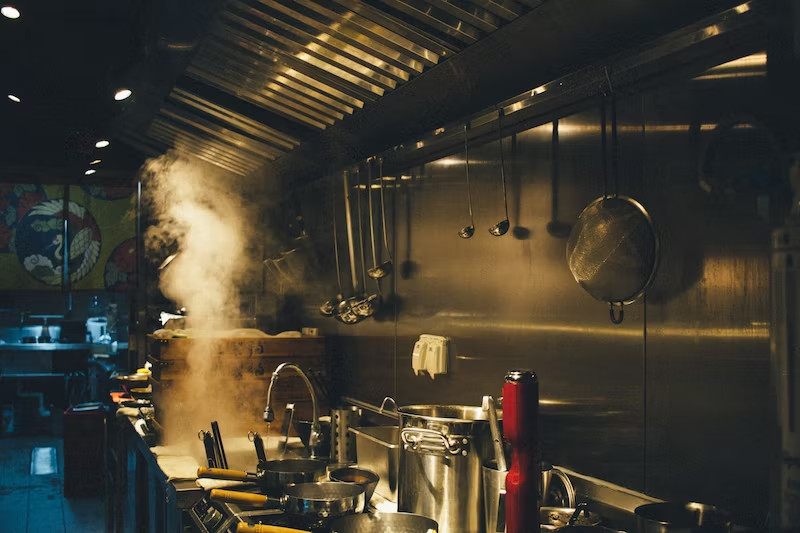
Operating supplies in a restaurant, including items like tableware, kitchen utensils, and cleaning materials, should ideally cost around 2-3% of total revenue. To optimize these costs, consider bulk purchasing for discounts, invest in durable, long-lasting supplies, and regularly review and manage inventory to avoid overstocking or wastage